John Hussman had a nice post on stock market valuations this Sunday. Article here. John is a very good economist. His weekly Market Comments are on my must-read list.
In it he quoted the same measure we are so fond of of referencing: Tobin's q. John has been pounding the table about this frothy market for some time. He admits that his warnings are often "early". That is the bane of the vast majority of value managers. It is also their "edge" or value creating discipline. That and the ability to hold on til gains are realized even though initial paper "losses" may appear from taking positions. Here's what John Hussman said ( for easy reference we repeat the chart given in our last post as well, as did he):
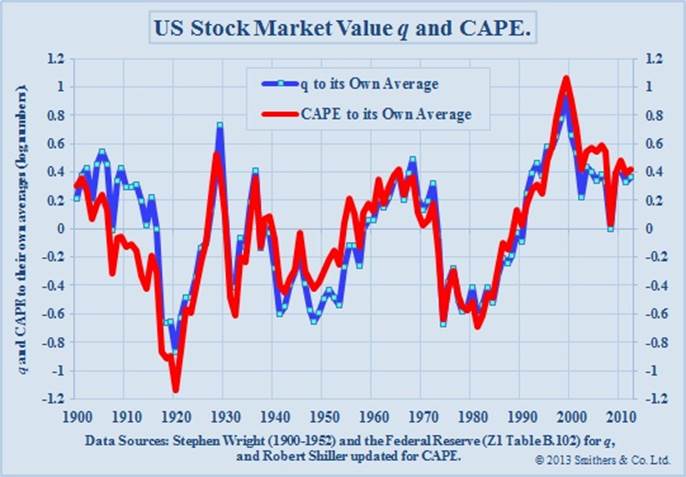
Andrew Smithers out of London provides yet another metric based on Tobin’s q (market value versus replacement cost). The chart below is on log scale, so you have to do a bit of math to translate to percentage over/undervaluation, for example, exp(0.42) = 1.52, or 52% overvaluation.The chart is based on data through the end of 2012. Smithers notes “At that date the S&P 500 was at 1426 and US non-financials were overvalued by 44% according to q and quoted shares, including financials, were overvalued by 52% according to CAPE. With the S&P 500 at 1552 the overvaluation was 57% for non-financials and 65% for quoted shares.”
Unfortunately, that seems about right. Let’s translate this into an estimate of prospective 10-year total returns, assuming underlying nominal economic growth rate of about 6.3% (which may be optimistic, but is a robust peak-to-peak norm across economic cycles, and is unlikely to be pessimistic), and a dividend yield of about 2.2% on the S&P 500. With that, a 65% overvaluation in quoted shares, reverting to fair valuation a decade from now, would imply a 10-year annual nominal total return on the S&P 500 of 1.063*(1/1.65)^(1/10) + .022 – 1 = 3.3% annually. That’s right in line with the estimates we obtain from a wide range of other historically reliable approaches (historically reliable in italics, because the “Fed Model” is not).Notice that in 1982, the -0.7 reading on Smithers’ log-scale chart implied that stocks were undervalued by exp(-0.7)-1 = -50%. At that point, with the dividend yield on the S&P 500 about 6.7%, one would have estimated a 10-year prospective total return for the S&P 500 of 1.063*(1/0.5)^(1/10)+.067 – 1 = 20.6% annually. One would have been correct.In contrast, note that in 2000, the 1.0 reading implied that stocks were overvalued by exp(1.0)-1 = 172%. At that point, with the dividend yield on the S&P 500 at just 1.2%, one would have estimated a 10-year prospective total return for the S&P 500 of 1.063*(1/2.72)^(1/10)+.012 = -2.6% annually. Again, one would have been correct.
Here's the rub though. Stocks had a long way to run in 1998-2000 from these levels. Not a reason one should adopt for staying of course. They even had a bit more room from 2004-2007. But in both instances a collapse followed and one would have been better off in Treasury bills and waiting for better valuations to appear. If not for the possibility of gains then certainly from a risk management perspective. This is not advice though. Please do your own due diligence!
No comments:
Post a Comment