Thursday, April 4, 2013

The Continuing Saga of Your House as An "Investment"

Sorry for getting this up late.

CoreLogic released its Negative Equity report for Q3 2012 on January 17, 2013. See here. It reports the number and percentage of homeowners that are “underwater” in their mortgages (owe more than their home is worth) by state.

All in all, 1.3 million mortgages moved from negative to positive equity during the quarter, a generally postive development. Across the nation, 22% of all mortgages are still underwater, down from 23.7% in the Q2 report. Nevada is the undisputed "titleholder" with 57% of mortgages under water; Florida occupies the second slot with 42%.  Nevada and Florida are also first and second in terms of high average loan-to-value ratios with Nevada at an astounding 109% and Florida at 86%.

Other highlights:
  • Arizona (39%), Georgia (36%), and Michigan (32%) rounded out the top 5 states with highest percentage of negative equity loans.
  • Nationally, there are 1.8 million more loans that are only 5% underwater. Another year of increases in prices could wipe another 18% of the negative equity mortgages off the list.
  • The bulk of the negative equity situation is at the market's low end (homes valued < $200,000). Nationally, 28.7% of all mortgaged homes with values under $200,000  are underwater compared with just 14.5% for homes valued above $200,000.
  • Net homeowners’ equity in all mortgaged properties increased $200 billion during the quarter from $3.6 trillion to $3.8 trillion. California accounted for 25% of this increase or about $52 billion (California accounts for 22% of the value of all mortgaged residential property). The top 5 states (those listed above) with the most negative equity loans accounted for another 25% of the $200 billion increase in national net homeowners’ equity.
In looking at the data, it's apparent that the worse states showed the most significant improvements. This is most likely due to the higher than average number of foreclosures and short sales (which eliminate mortgage debt entirely) in those states. Also, three of these states (Nevada, Arizona, and Florida) experienced large rates of appreciation in the 3rd quarter, with some pundits are attributing this to large scale buying by investment groups, such as Blackstone and JP Morgan.


Tuesday, April 2, 2013

Tobin's q Redux

 John Hussman had a nice post on stock market valuations this Sunday. Article here. John is a very good economist. His weekly Market Comments are on my must-read list. 

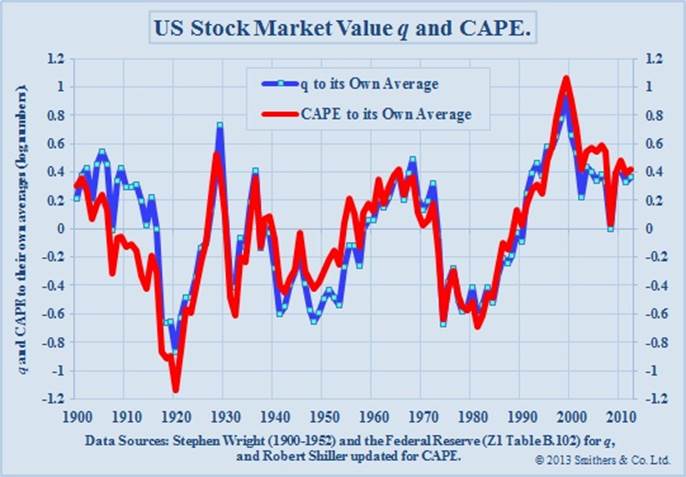
In it he quoted the same measure we are so fond of of referencing: Tobin's q. John has been pounding the table about this frothy market for some time. He admits that his warnings are often "early". That is the bane of the vast majority of value managers. It is also their "edge" or value creating discipline. That and the ability to hold on til gains are realized even though initial paper "losses" may appear from taking positions.  Here's what John Hussman said ( for easy reference we repeat the chart given in our last post as well, as did he):

Andrew Smithers out of London provides yet another metric based on Tobin’s q (market value versus replacement cost). The chart below is on log scale, so you have to do a bit of math to translate to percentage over/undervaluation, for example, exp(0.42) = 1.52, or 52% overvaluation.
The chart is based on data through the end of 2012. Smithers notes “At that date the S&P 500 was at 1426 and US non-financials were overvalued by 44% according to q and quoted shares, including financials, were overvalued by 52% according to CAPE. With the S&P 500 at 1552 the overvaluation was 57% for non-financials and 65% for quoted shares.”  
http://www.smithers.co.uk/images/150313115226.jpg
Unfortunately, that seems about right. Let’s translate this into an estimate of prospective 10-year total returns, assuming underlying nominal economic growth rate of about 6.3% (which may be optimistic, but is a robust peak-to-peak norm across economic cycles, and is unlikely to be pessimistic), and a dividend yield of about 2.2% on the S&P 500. With that, a 65% overvaluation in quoted shares, reverting to fair valuation a decade from now, would imply a 10-year annual nominal total return on the S&P 500 of 1.063*(1/1.65)^(1/10) + .022 – 1 = 3.3% annually. That’s right in line with the estimates we obtain from a wide range of other historically reliable approaches (historically reliable in italics, because the “Fed Model” is not).
Notice that in 1982, the -0.7 reading on Smithers’ log-scale chart implied that stocks were undervalued by exp(-0.7)-1 = -50%. At that point, with the dividend yield on the S&P 500 about 6.7%, one would have estimated a 10-year prospective total return for the S&P 500 of 1.063*(1/0.5)^(1/10)+.067 – 1 = 20.6% annually. One would have been correct.
In contrast, note that in 2000, the 1.0 reading implied that stocks were overvalued by exp(1.0)-1 = 172%. At that point, with the dividend yield on the S&P 500 at just 1.2%, one would have estimated a 10-year prospective total return for the S&P 500 of 1.063*(1/2.72)^(1/10)+.012 = -2.6% annually. Again, one would have been correct.

Here's the rub though. Stocks had a long way to run in 1998-2000 from these levels. Not a reason one should adopt for staying of course. They even had a bit more room from 2004-2007. But in both instances a collapse followed and one would have been better off in Treasury bills and waiting for better valuations to appear. If not for the possibility of gains then certainly from a risk management perspective. This is not advice though. Please do your own due diligence!


Tuesday, March 26, 2013

Spring Break


My family and I are visiting family and friends in Ohio this week. The drive down from Wisconsin was snowy- and if the thirty plus cars and tractor trailers in the ditches were any evidence- treacherous as well. Apparently white out conditions were to blame.

Last year it was near eighty degrees out when we made this trip. This year: 35.

More posts are coming soon. I promise.

Wednesday, March 20, 2013

What Is The Market Saying?: CAPE and q


With the S&P500 having recently reached withing fifty cents on a closing basis of a new high recently, I think it is prudent to have a look at what some market valuation indicators are saying. We have referred to this source before. This is an image from Smithers & Co.which I believe to be the ultimate authority on stock market valuation as calculated in q, that being the value of the replacement cost of corporate assets. The chart, which also includes Shiller's cyclically adjusted 10 year values of price earning ratios (CAPE10) shows the q ratio against its geometric mean, thereby yielding a percentage above or below fair value. Fair value is assumed to be equal to replacement cost. For a more in depth discussion of the rationale for this measure, please refer to Smithers' two books: Valuing Wall Street and Wall Street Revalued.


So what is this tool saying? Let's have the folks at Smithers & Co. spell it out for us:


With the publication of the Flow of Funds data up to 31st December, 2012 (on 7th March, 2013) we have updated our calculations for q and CAPE. Over the past year net worth has risen by 7.6%, with the most significant rise being in the value ascribed to real estate (+ 5.9%). Interest-bearing assets have risen by 5.8% while interest bearing liabilities have risen by 8.2%.

Both q and CAPE include data for the year ending 31st December, 2012. At that date the S&P 500 was at 1426 and US non-financials were overvalued by 44% according to q and quoted shares, including financials, were overvalued by 52% according to CAPE. (It should be noted that we use geometric rather than arithmetic means in our calculations.)

As at 12th March, 2013 with the S&P 500 at 1552 the overvaluation by the relevant measures was 57% for non-financials and 65% for quoted shares.

Although the overvaluation of the stock market is well short of the extremes reached at the year ends of 1929 and 1999, it has reached the other previous peaks of 1906, 1936 and 1968. (here)

Sixty five percent! I have opined elsewhere on the difficulty of using this information as a timing tool. Both it and CAPE10 are measures that require a long term (10 years?) view in order to even consider its use. In fact, Smithers & Co. publish this information only quarterly, when they have verifiable sources for its calculation (Federal Reserve Flow of Funds data, etc.). Nevertheless, this measure has to give anyone considering new investments in the market great pause-- and existing investors a test of their tolerance potential for losses. Of course the overvaluation was MUCH worse in 2000 and slightly worse is 2007. The former led to losses of nearly 50% and the latter to greater than 50% losses. Yet here we are again with the S&P500 at the 1550 level and the market seemingly rich by a significant margin. Caveat emptor.

Thursday, March 14, 2013

Wealth Inequality in America

I am hoping this post comes off as non-political. We try to present information here without a slant to it. If there is a bias- and there probably is- it is anti Wall Street and pro Main Street. It is anti wealth skimming activities and pro wealth creation.

 The following video has gone viral. It should. There's something wrong with wealth distribution in the United States. I firmly believe that people should be rewarded for working hard. I also believe that the U.S. can have a safety net under incomes that provide for those who- for one reason or another- can't adequately provide for themselves and their dependents. I can hold these views simultaneously without much difficulty. Right and left can have rational discussions about this. The abundance of the U.S. can easily provide for almost any outcome. It is only a matter of choice. Guns or butter.


This video needs discussion. (Without rancor please!)

Mark

Tuesday, March 12, 2013

Ten Stock Market Myths

I am going to revive a post that I intended to put up during the initial rebound from the 2008-09 selloff. This advice has been around for awhile and the original article is attributable to Brett Arends. He wrote it in 2010. The full story is here.

I think it is particularly timely, given what is going on in the stock market. I am not suggesting that everyone become a market-timer. It's too difficult psychologically. It's less so at tops: the market has moved up- often to extreme valuations- and everyone has the urge to lock profits in. It feels smart. What is doubly difficult is to place money at risk when the world seems it is about to come to an end. Think March 2009. It feels wrong. Your hand shakes when placing the buy order. Then the market continues to sell down. You see red. And you want to "cut losses". THAT now seems the smart thing to do. But very often it is the wrong thing. If only we were computers and could take the emotion out of such decisions! But we are not.

Have a read.

Ten Stock-Market Myths That Just Won't Die

At times like this, your broker or financial adviser may offer words of wisdom or advice. There are standard calming phrases you will hear over and over again. But how true are they? Here are 10 that need extra scrutiny.
1. "This is a good time to invest in the stock market."

Really? Ask your broker when he warned clients that it was a bad time to invest. October 2007? February 2000? A broken watch tells the right time twice a day, but that's no reason to wear one. Or as someone once said, asking a broker if this is a good time to invest in the stock market is like asking a barber if you need a haircut. "Certainly, sir -- step this way!"

2. "Stocks on average make you about 10% a year."

Stop right there. This is based on some past history -- stretching back to the 1800s -- and it's full of holes.

About three of those percentage points were only from inflation. The other 7% may not be reliable either. The data from the 19th century are suspect; the global picture from the 20th century is complex. Experts suggest 5% may be more typical. And stocks only produce average returns if you buy them at average valuations. If you buy them when they're expensive, you do a lot worse.

3. "Our economists are forecasting..."

Hold it. Ask your broker if the firm's economist predicted the most recent recession -- and if so, when.

The record for economic forecasts is not impressive. Even into 2008 many economists were still denying that a recession was on the way. The usual shtick is to predict "a slowdown, but not a recession." That way they have an escape clause, no matter what happens. Warren Buffett once said forecasters made fortune tellers look good.

4. "Investing in the stock market lets you participate in the growth of the economy."

Tell that to the Japanese. Since 1989 their economy has grown by more than a quarter, but the stock market is down more than three quarters. Or tell that to anyone who invested in Wall Street a decade ago. And such instances aren't as rare as you've been told. In 1969, the U.S. gross domestic product was about $1 trillion, and the Dow Jones Industrial Average was at about 1000. Thirteen years later, the U.S. economy had grown to $3.3 trillion. The Dow? About 1000.

5. "If you want to earn higher returns, you have to take more risk."

This must come as a surprise to Mr. Buffett, who prefers investing in boring companies and boring industries. Over the last quarter century, the FactSet Research utilities index has even outperformed the exciting, "risky" Nasdaq Composite index. The only way to earn higher returns is to buy stocks cheap in relation to their future cash flows. As for "risk," your broker probably thinks that's "volatility," which typically just means price ups and downs. But you and your Aunt Sally know that risk is really the possibility of losing principal.

6. "The market's really cheap right now. The P/E is only about 13."

The widely quoted price/earnings (PE) ratio, which compares share prices to annual after-tax earnings, can be misleading. That's because earnings are so volatile -- they're elevated in a boom, and depressed in a bust.

Ask your broker about other valuation metrics, like the dividend yield, which looks at the dividends you get for each dollar of investment; or the cyclically adjusted PE ratio, which compares share prices to earnings over the past 10 years; or "Tobin's q," which compares share prices to the actual replacement cost of company assets. No metric is perfect, but these three have good track records. Right now all three say the stock market's pretty expensive, not cheap

.
7. "You can't time the market."

This hoary old chestnut keeps the clients fully invested. Certainly it's a fool's errand to try to catch the market's twists and turns. But that doesn't mean you have to suspend judgment about overall valuations.

If you invest in shares when they're cheap compared to cash flows and assets -- typically this happens when everyone else is gloomy -- you will usually do very well.

If you invest when shares are very expensive -- such as when everyone else is absurdly bullish -- you will probably do badly

8. "We recommend a diversified portfolio of mutual funds."

If your broker means you should diversify across things like cash, bonds, stocks, alternative strategies, commodities and precious metals, then that's good advice.

But too many brokers mean mutual funds with different names and "styles" like large-cap value, small-cap growth, midcap blend, international small-cap value, and so on. These are marketing gimmicks. There is, for example, no such thing as "midcap blend." These funds are typically 100% invested all the time, and all in stocks. In this global economy even "international" offers less diversification than it did, because everything's getting tied together.

9. "This is a stock picker's market."

What? Every market seems to be defined as a "stock picker's market," yet for most people the lion's share of investment returns -- for good or ill -- has typically come from the asset classes (see No. 8, above) they've chosen rather than the individual investments. And even if this does turn out to be a stock picker's market, what makes you think your broker is the stock picker in question?

10. "Stocks outperform over the long term."

Define the long term? If you can be down for 10 or more years, exactly how much help is that? As John Maynard Keynes, the economist, once said: "In the long run we are all dead."

I'll put up a post shortly sharing some valuation metrics for the market. This blog is about planning and wealth preservation and accumulation. Not advice but use it to plan accordingly.

Thursday, March 7, 2013

Roth IRAs: A Bad Idea?

I have a feeling this may turn out to be one of the most useful things I EVER post.David Collum is a professor at Cornell University and a wickedly funny financial pundit and sometime blogger. Perhaps more consistent and better than I on that count. ;) Each year since 2009 he has written an annual review of what he has found most important to him and his investing thesis. It's a great read. Google it.

Last year his think piece contained a discussion of Roth IRAs. He has an interesting take. In short, he believes they are a scam. I could re-characterize what he said but I found the whole argument so worthwhile that I am going to simply CUT AND PASTE IT and let you hear David and what he has to say, because by comparison to David I am a very poor writer. I did omit the numerous embedded citations though. Enjoy!
Roth IRA: A Bad Idea
Before leaving the world of pensions I’m gonna pick a fight with Roth IRAs. When the Roth IRA was first announced I had a unique—as in only-guy-on-the-planet unique—visceral response. The original IRA was very farsighted: Savers were allowed to compound wealth unfettered by taxes while the government deferred tax revenues to future generations. By contrast, the Roth IRA pulled tax revenues forward, leaving future generations to take a hike. Imagine the truly awesome demographic problems we would have if the Roth had been introduced in the 60s and the entire baby boom generation became entirely tax exempt. Was this an oversight? I don’t think so. The introduction of the Roth and the substantial revenues from regular-to-Roth rollovers coincided with the Clinton administration’s efforts to balance the on-balance-sheet Federal budget for the first time in decades. That is my minor gripe. To set up my really big gripe we must first dispel a widely held misconception and a common oversight.  In a regular IRA, the money is taxed at the end, whereas in a Roth IRA taxes are levied up front. If the two are taxed at the same rate—this is a critical provision—the outcome is identical. They are not just similar, it’s an identity. Break out your calculator if you must. There is no differential advantage offered by compounding in the Roth over the regular IRA. Simply put: Any advantage of the Roth IRA relative to a regular IRA necessarily stems from a lower tax rate while working than in retirement. Period/full stop.  The tax rates of the Roth and regular IRAs are fundamentally different: Roth IRA: Front-end loaded taxes paid at the marginal tax rate (highest tax bracket). Regular IRA: Back-end loaded taxes paid at the effective tax rate (integrated over all tax brackets). The distinction of marginal versus effective tax rate is critical and seems to be lacking from most analyses. One can calculate marginal and effective rates for any income online.  Let’s return to the top-5-percentile family—the 5 percenter. If they had used a regular IRA, they would be paying a 7% effective tax rate incurred on their $48,000 per year withdrawal in retirement. They paid an approximate 32% marginal tax rate—the tax rate at the top bracket—to shelter a few thousand per year in a Roth IRA. The numbers simply do not work. It is worse than that. Let us consider the lucky soul family—the extraordinarily rare couple—who actually accrued 25 annual salaries in their retirement account. For this family a 4% annual withdrawal will be equal to an annual salary while working, placing them in the same tax bracket (ignoring unknowable tax law changes). Even so, they paid 32% marginal tax on the Roth to avoid a 22% effective tax rate incurred by the regular IRA. The numbers still don’t work. I do not understand why the Roth is being sold so enthusiastically to the public. Now ponder all those folks who rolled over a lump sum from a regular to a Roth IRA. They not only paid the marginal tax rate on the rollover but caused the marginal rate to spike to a higher level! It’s hard to imagine that will prove to be a smart move. Congress is considering moving all pension funds to what is effectively Roth IRA rules as part of their Fiscal Cliff negotiations. You young guys are about to get hosed.

It didn't happen but Congress WAS entertaining that last idea. Is it coming? I don't know but it's a huge watch out. Anyway, a great take on Roth IRAs and a valuable counterpoint to all the financial planners and brokers who eagerly pushed their clients into the Roth orbit in The Great Roth Asset Collection of 2011/2012 that we discussed before.

Tuesday, March 5, 2013

The Rising Tide of Taxes

An ongoing theme of this blog is the necessity of rising taxes in an economy structured in a manner such as ours. Whether it is Tax Freedom Day or Cost of Government Day, we see the historical trend toward later and later dates by and large to fund the operations of government in the U.S. Here's the announcement from the Americans for Tax Reform Foundation and the Center for Cost of Government:
In 2012, Cost of Government Day falls on July 15. Working people must toil 197 days out of the year just to meet all costs imposed by government. 2012 marks the fourth consecutive year COGD has fallen in July. From a different perspective, the cost of government makes up 54.0 percent of annual gross domestic product (GDP).
The most telling event in the latest "fiscal cliff" negotiations was both parties agreeing to end the payroll tax holiday (2%)at a moment in time where the economy was visibly weak. Wow. The government is simply desperate for income.

Note: Last year's date was favorably revised to July 18 from an August initial estimate. The 2012 date represents a three day improvement. Prior to 2008, the date had never fallen past June. The past 4 years have occurred mid-July. MPM